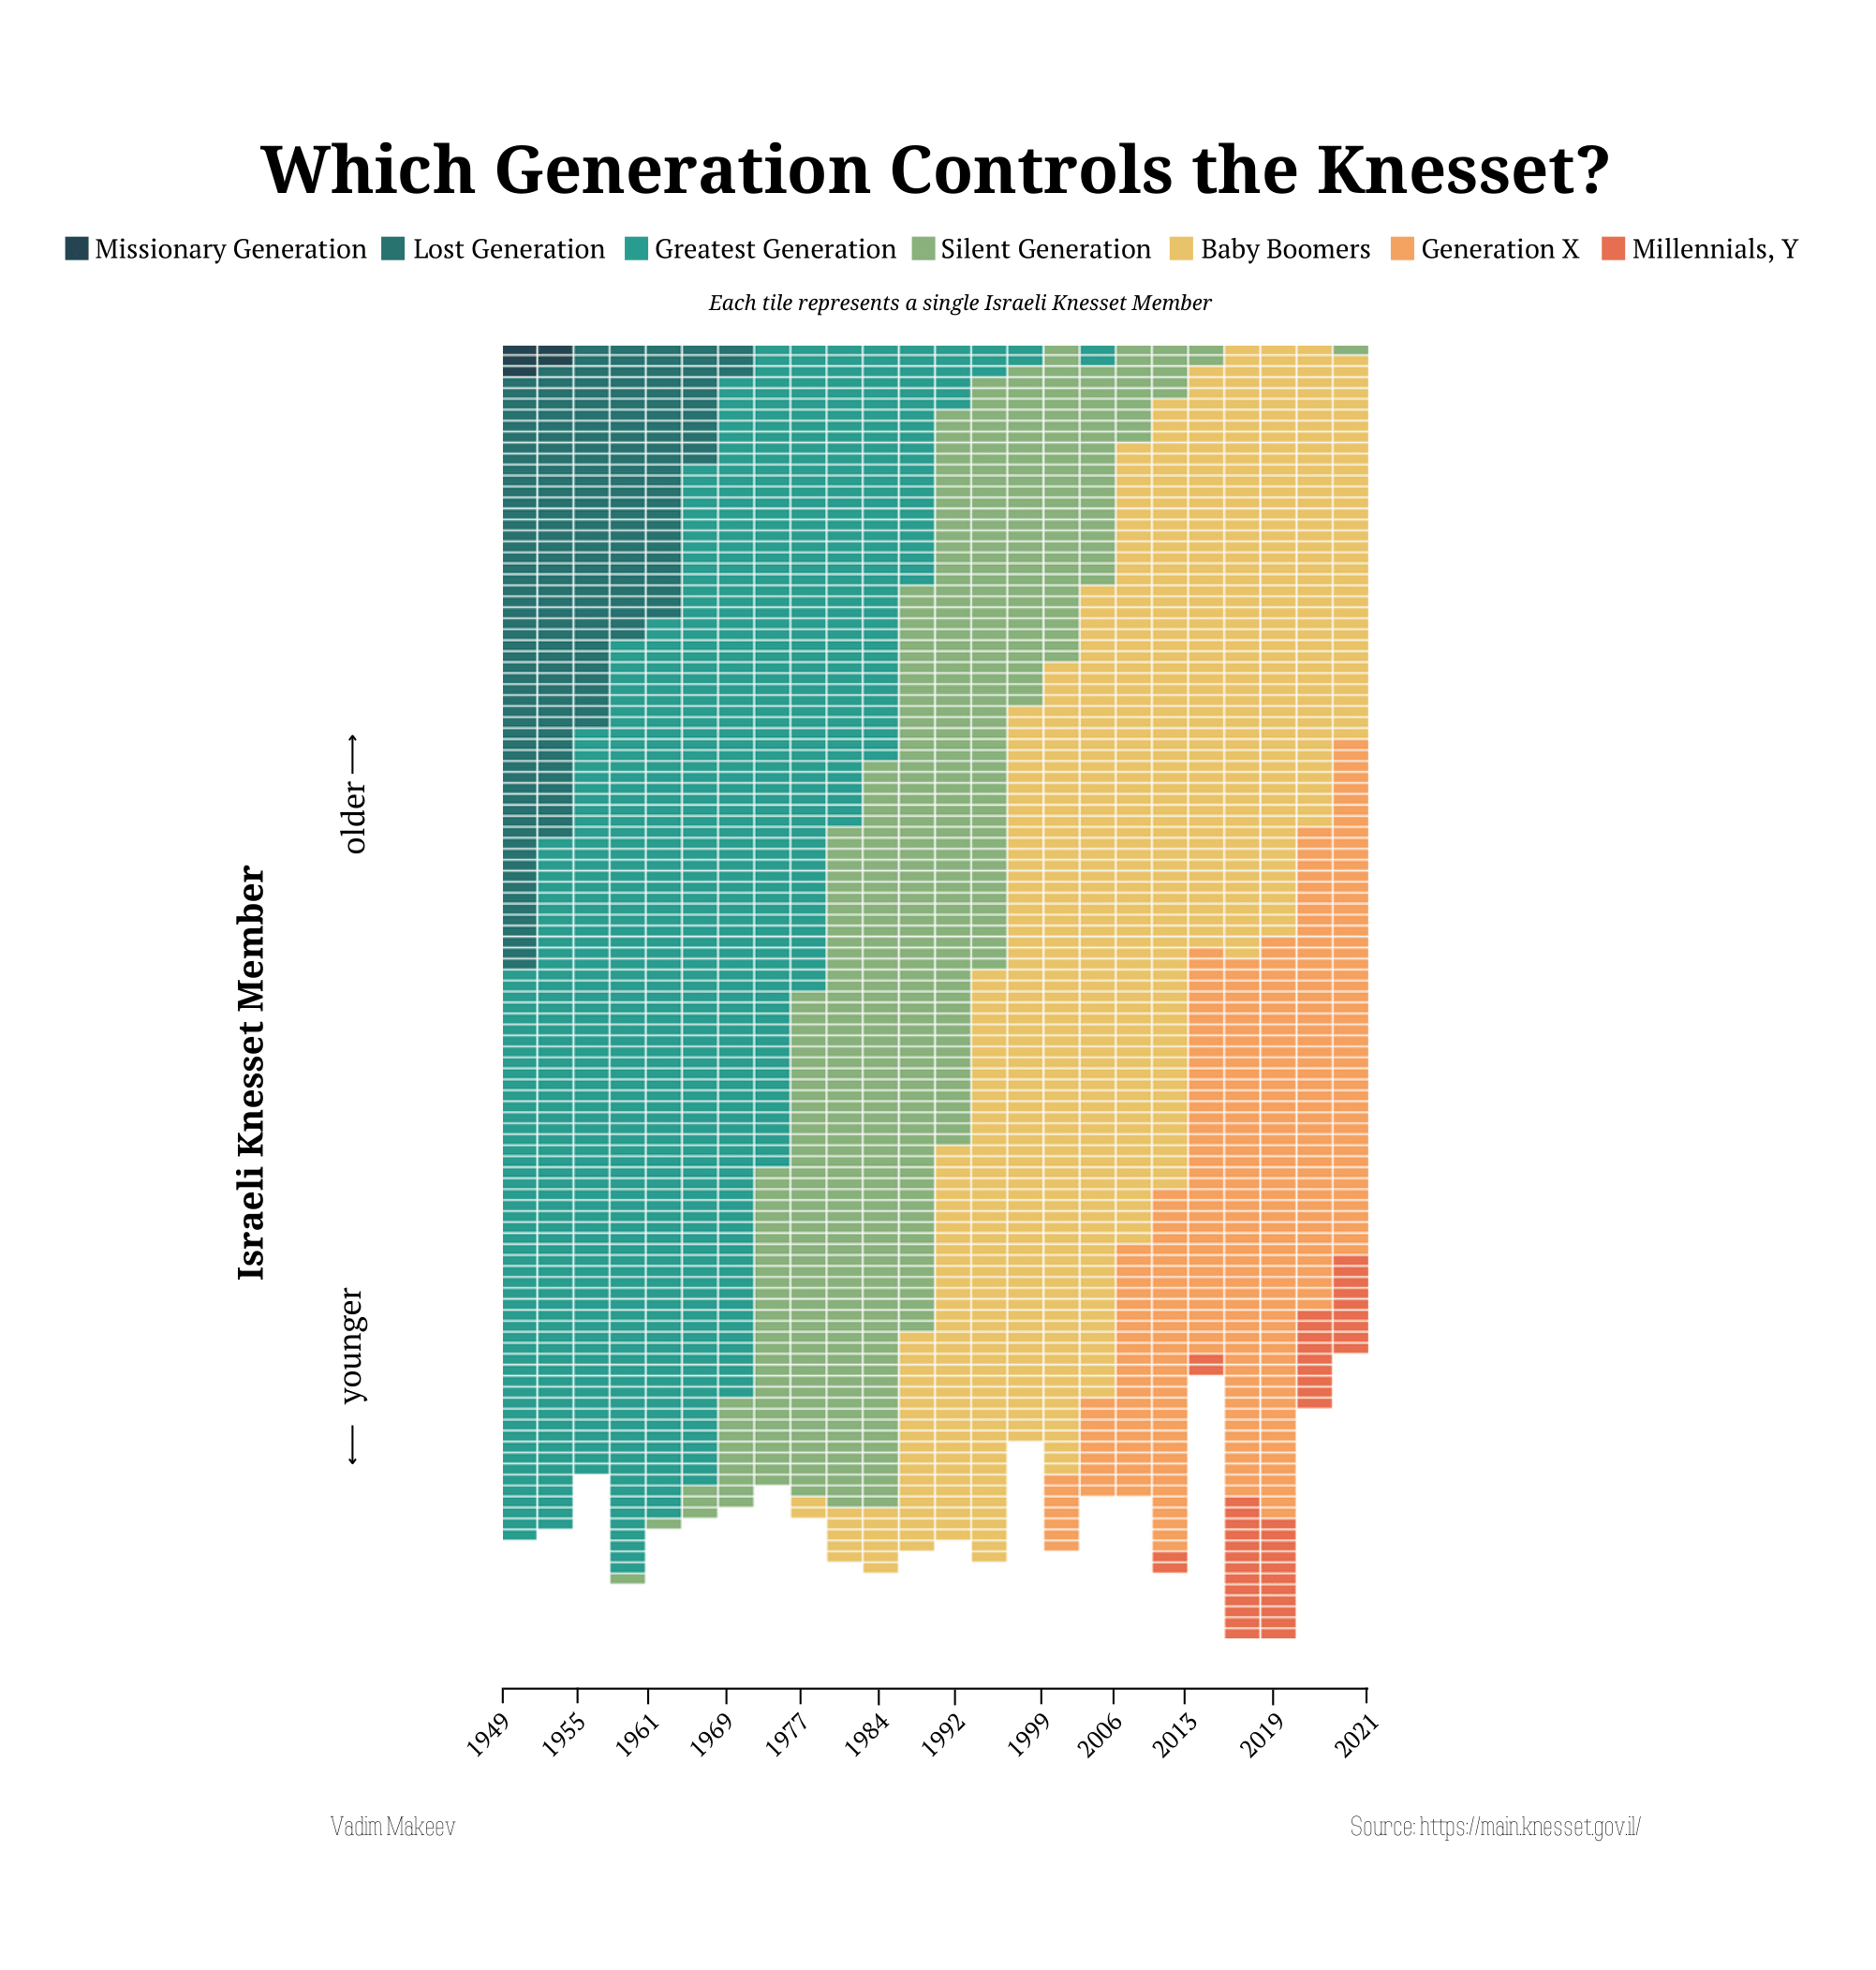
The Israeli Knesset
by Generations
This project was inspired by the work of Will Donnell, who looked into the US Senate.
About This Chart
The data used to populate this chart was sourced from an Excel dataset I created,
Which itself was sourced from the Israeli Knesset Website.
Generational breakdown uses age brackets defined by the Pew Research Center, except for "Missionary Generation", which is defined by the Strauss–Howe generational theory:
| Name | Birth Years |
|---|---|
| Missionary Generation | 1860-1882 |
| Lost Generation | 1883-1900 |
| Greatest Generation | 1901-1927 |
| Silent Generation | 1928-1945 |
| Baby Boomers | 1946-1964 |
| Generation X | 1965-1980 |
| Millennials Y | 1981-1996 |
Vacancies in the Israeli Knesset are not uncommon. For instance, when a Knesset member dies or resigns.
The tiles on this chart use the Knesset member that was holding the seat for the majority of the term.
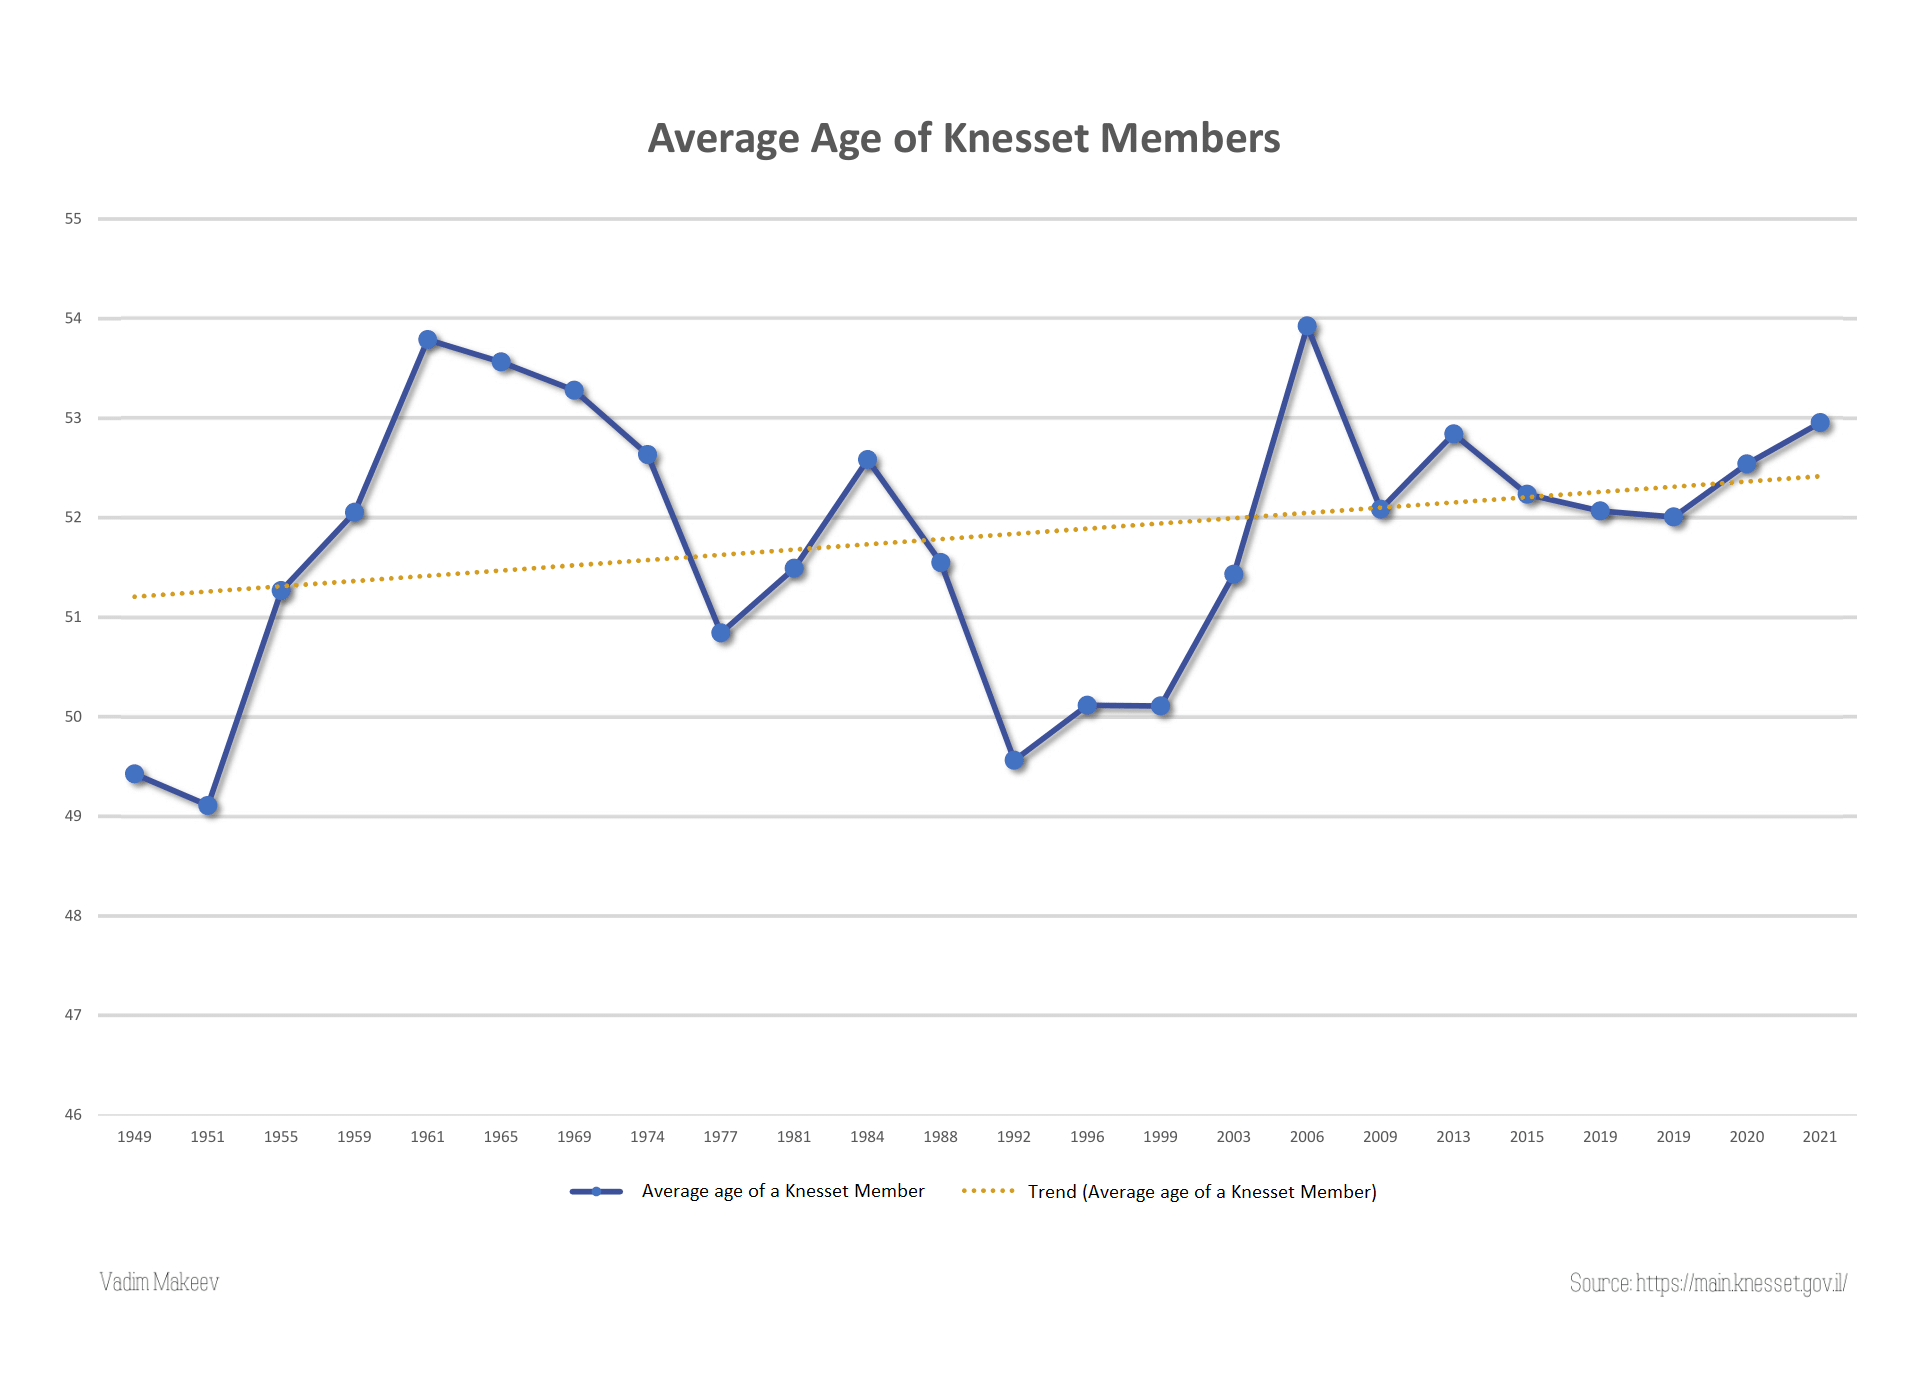
As I was going through the data I noticed how the average age of a Knesset Member has increased over the years.
Another view
This graph shows the Average Age of Knesset Member, by Year of Knesset.
The making of the project
This project was inspired by the work of Will Donnell, who looked into the US Senate.
Searching for a similar representation for the Israeli Knesset, and finding none, I decided on making one myself. However, there were no premade structured data or API. The closest thing available was the Israeli Knesset website, presenting pictures and dates of birth.
After considering the potential legal implication of scraping a government website, I decided to construct the dataset by hand, from scratch. Raw data was cleaned, validated, filtered, and conditionally formatted. The resulting table was further processed with a graphic design tool, to make a presentable and user-friendly slide.
For more works visit My Website.